AfricurityAI

Poverty Research in America

Comprehensive analysis of poverty distribution and related factors across the United States.

Geographic Distribution of Poverty

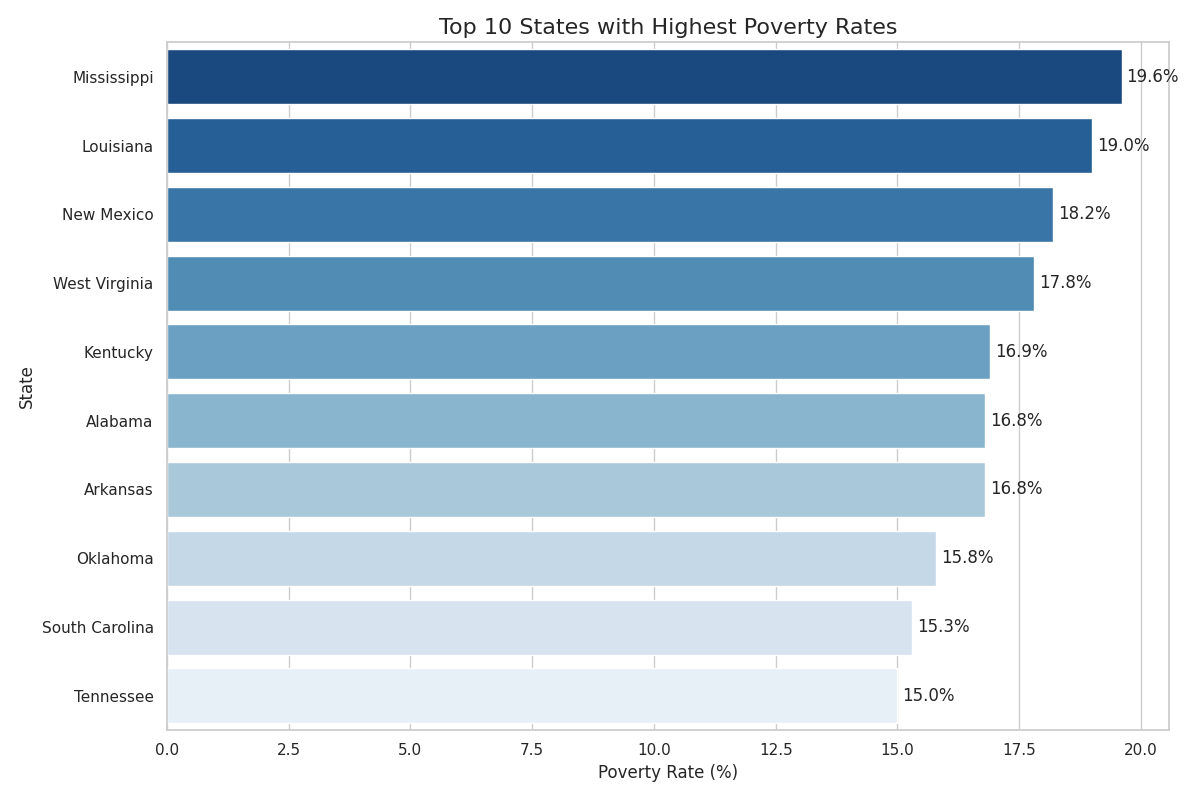
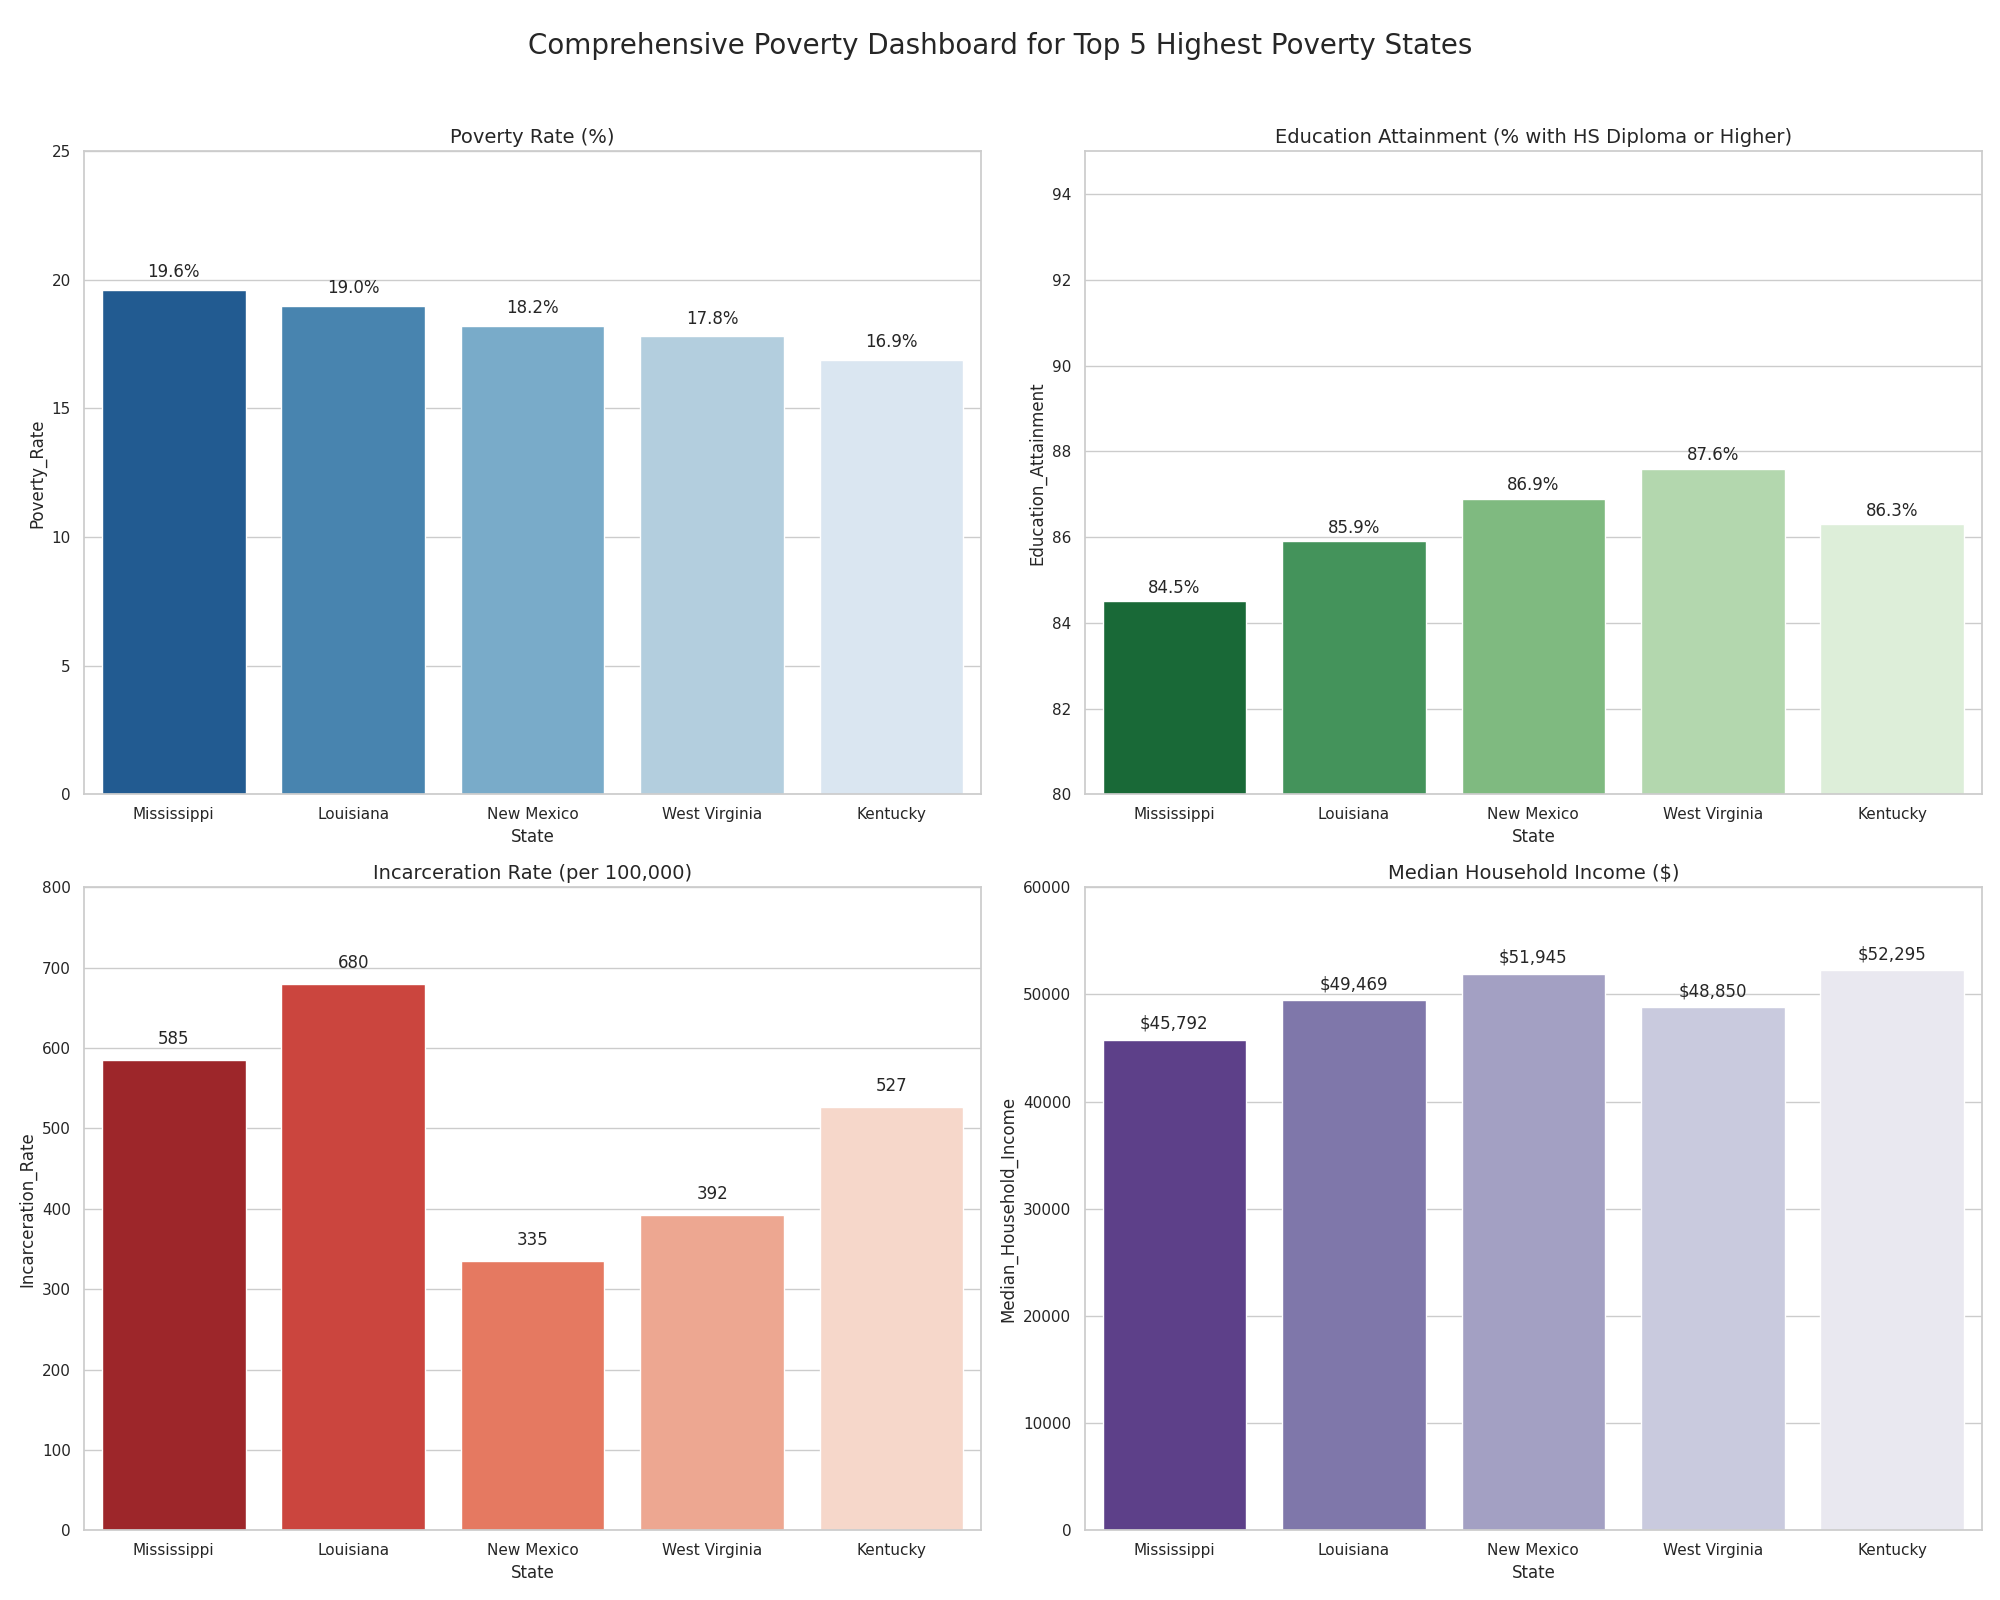
States with Highest Poverty Rates

  1. Mississippi (19.6%)
  2. Louisiana (19.0%)
  3. New Mexico (18.2%)
  4. West Virginia (17.8%)
  5. Kentucky (16.9%)
  6. Alabama (16.8%)
  7. Arkansas (16.2%)
  8. Oklahoma (15.6%)
  9. Tennessee (15.2%)
  10. South Carolina (15.0%)

Southern states consistently show the highest poverty rates in the nation, with Mississippi, Louisiana, and New Mexico experiencing nearly one in five residents living below the poverty line.

Top States by Poverty Rate
Poverty Dashboard

Cities with Highest Poverty Rates

  1. Detroit, MI (33.4%)
  2. Cleveland, OH (30.8%)
  3. Brownsville, TX (30.2%)
  4. Hartford, CT (28.3%)
  5. Newark, NJ (27.8%)
  6. Buffalo, NY (26.9%)
  7. Rochester, NY (25.3%)
  8. Milwaukee, WI (25.0%)
  9. Cincinnati, OH (23.5%)
  10. Philadelphia, PA (23.3%)

Urban centers in the Midwest and Northeast show particularly high poverty rates, with Detroit having one-third of its population living below the poverty line.

Demographic Patterns of Poverty

Poverty Rates by Race/Ethnicity

  • American Indian/Alaska Native: 23.0%
  • Black/African American: 19.5%
  • Hispanic/Latino: 17.2%
  • Native Hawaiian/Pacific Islander: 13.8%
  • Multiple Races: 13.2%
  • White (non-Hispanic): 8.2%
  • Asian: 7.6%

Significant racial disparities exist in poverty rates, with American Indian/Alaska Native and Black/African American populations experiencing poverty at more than twice the rate of White (non-Hispanic) populations.

Poverty Rates by Age Group

  • Children (Under 18): 16.9%
  • Working Age Adults (18-64): 11.4%
  • Seniors (65+): 9.7%

Children experience poverty at significantly higher rates than other age groups, with nearly one in six children living below the poverty line.

Poverty Rates by Household Type

  • Female-headed households with children: 25.6%
  • Male-headed households with children: 12.4%
  • Married couples with children: 5.8%

Female-headed households with children experience poverty at more than four times the rate of married couples with children.

Digital Access and the Digital Divide

Internet Access by Geography

  • Urban areas: 90.5% have internet access
  • Suburban areas: 90.2% have internet access
  • Rural areas: 78.6% have internet access

Rural areas lag significantly behind urban and suburban areas in internet access, with more than one in five rural households lacking internet connectivity.

Internet Access by Income

  • Households earning less than $25,000: 65.1% have internet access
  • Households earning $25,000-$49,999: 81.9% have internet access
  • Households earning $50,000-$99,999: 93.5% have internet access
  • Households earning $100,000+: 97.8% have internet access

A stark digital divide exists based on income, with low-income households having significantly lower rates of internet access compared to higher-income households.

Digital Access by Race/Ethnicity

Digital Access by Race/Ethnicity

  • Asian: 95.5% digital access
  • White (non-Hispanic): 89.4% digital access
  • Hispanic/Latino: 80.8% digital access
  • Black/African American: 79.6% digital access
  • American Indian/Alaska Native: 67.3% digital access

Significant racial disparities exist in digital access, with American Indian/Alaska Native populations having access rates nearly 30 percentage points lower than Asian populations.

Correlations with Education and Incarceration

Educational Attainment and Poverty

Poverty rates decrease significantly with higher levels of educational attainment:

  • Less than high school diploma: 24.7% poverty rate
  • High school graduate: 13.2% poverty rate
  • Some college/associate's degree: 9.1% poverty rate
  • Bachelor's degree or higher: 4.0% poverty rate

Individuals without a high school diploma are six times more likely to live in poverty compared to those with a bachelor's degree or higher.

Educational Resource Disparities

High-poverty school districts face significant resource challenges:

  • Per-pupil funding gap: High-poverty districts receive approximately $1,000 less per student than low-poverty districts
  • Teacher experience: Teachers in high-poverty schools have an average of 3.9 fewer years of experience
  • Technology access: 58% of high-poverty schools report inadequate digital resources
  • Advanced course offerings: High-poverty schools offer 25% fewer advanced courses
  • Counselor-to-student ratio: 1:618 in high-poverty schools vs. 1:352 in low-poverty schools

These educational resource disparities contribute to perpetuating cycles of poverty across generations.

Incarceration and Poverty

Strong correlations exist between poverty and incarceration rates:

  • Childhood poverty: Children who grow up in poverty are 3x more likely to be incarcerated
  • Pre-incarceration income: Incarcerated individuals had a median pre-incarceration income 41% lower than non-incarcerated individuals of similar age
  • Post-release poverty: Formerly incarcerated individuals experience poverty rates over 27%
  • Geographic correlation: States with higher poverty rates show 23% higher incarceration rates on average

The relationship between poverty and incarceration creates a cycle that is difficult to break without targeted interventions.

Implications for AI Literacy

The research findings on poverty in America have several important implications for AI literacy initiatives:

Geographic Prioritization

AI literacy initiatives should prioritize the Southern states and urban centers in the Midwest and Northeast with the highest poverty rates. These areas represent the greatest need and potential impact.

Digital Access Considerations

AI literacy programs must address the digital divide by providing both online and offline resources, with particular attention to rural areas and communities with limited internet access.

Demographic Targeting

Initiatives should develop culturally responsive approaches for communities with the highest poverty rates, including American Indian/Alaska Native and Black/African American populations.

Educational Integration

AI literacy should be integrated into existing educational systems while addressing resource disparities in high-poverty school districts through supplemental programming and resources.

Economic Opportunity Focus

Programs should emphasize the economic opportunities that AI literacy can provide, particularly for communities with high poverty rates and limited economic mobility.

Systemic Approach

AI literacy initiatives must address systemic barriers by working across multiple sectors including education, workforce development, and community services.